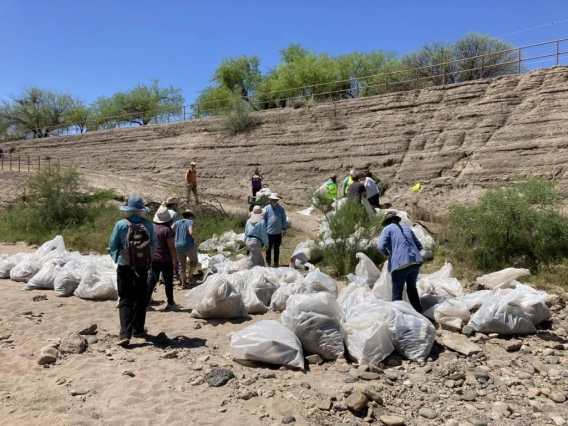
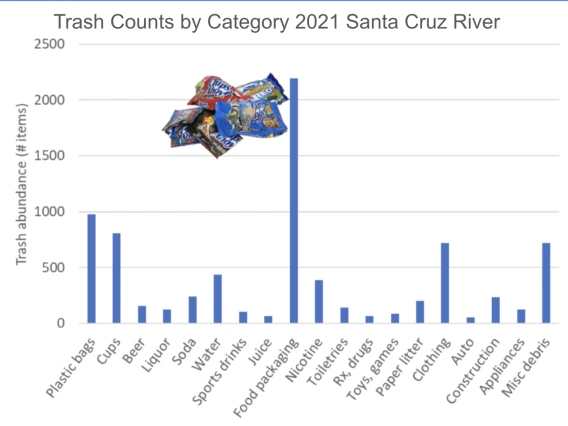
In this activity, students will interpret graphed trash collection data from the Santa Cruz River in Tucson as the complete context is gradually provided. This activity guides students through noticing and wondering as parts of the graph are revealed.
- Objectives
- Students will construct an evolving interpretation of data while gaining a deeper understanding of human impacts on the environment.
- Grades: 6 to 8 (Adaptable to high school)
- Time: Bellwork or short activity
- Author: A Spencer
Arizona Standards Engaged
6.E2U3.11 Develop and use a model to explain how the availability of natural resources and changes in climate have influenced human activity. Understanding how human activities (like pollution or conservation) affect the environment. Using data (like graphs) to make sense of environmental changes and impacts.
Teaching Slides