
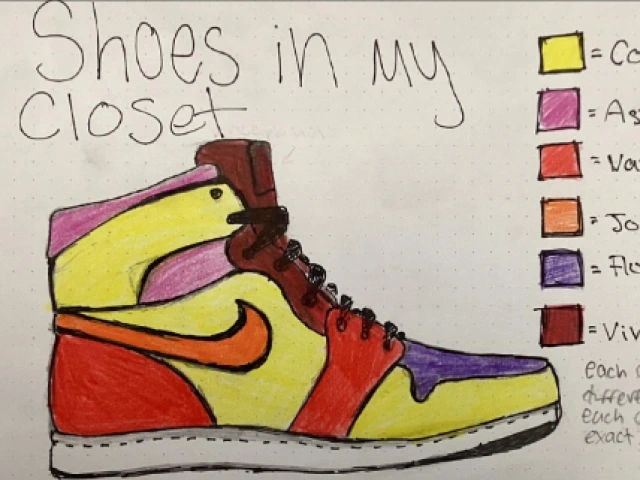
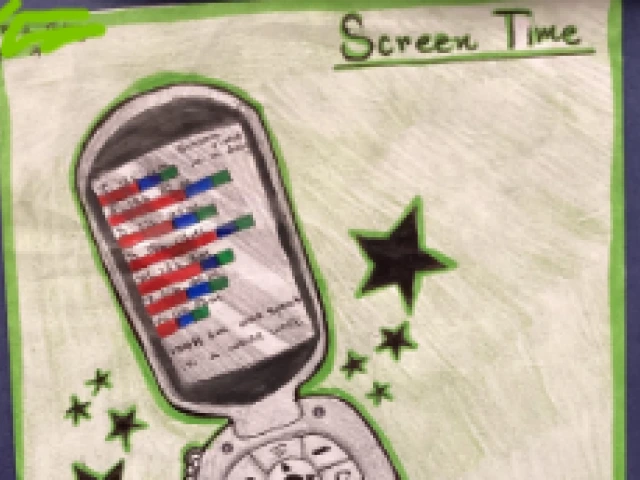
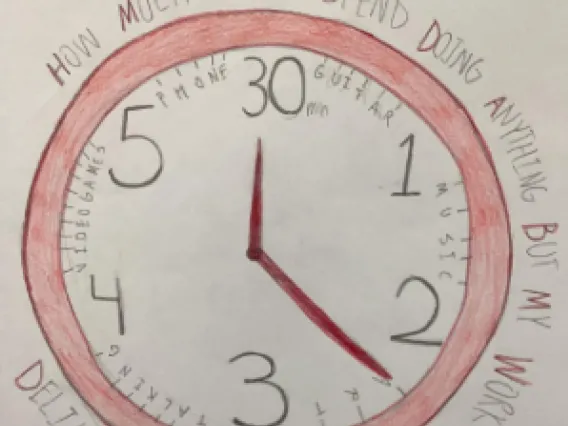
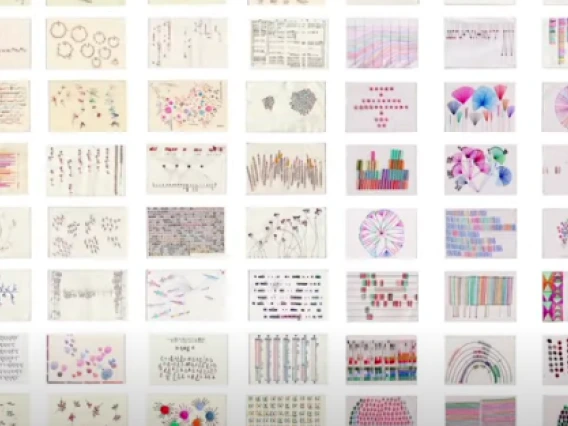
In this activity, students use data visualization methods presented in Dear Data: A Friendship in 52 Weeks of Postcards to introduce themselves at the beginning of the school year. Dear Data details a pen-pal data sharing project between two friends (Thriftbooks link). This activity will engage students with data in a fun and individualized way, strengthen data literacy skills, and if done early in the school year, build interpersonal relationships.
- Objective
- Students create a visual representation of data they collect about themselves over a set period of time.
- Grades: 6, 7, 8 - adaptable to 9 thru 12
- Time: 2 class periods, data collection time frame flexible
- Author: Dean Holbrook
Arizona Standards Engaged
Science & Engineering Practices
Ask questions and define problems - Develop and use models - Plan and carry out investigations - Analyze and interpret data - Use mathematics and computational thinking - Construct explanations and design solutions - Engage in argument from evidence - Obtain, evaluate, and communicate information
Math Practices
Reason abstractly and quantitatively - Real world statistical information gathering - Data expression
Student Instructions
Activity Plan
Gallery Walk Student Worksheet
Dear Data Resources
Dear Data Website: https://www.dear-data.com/theproject
Dear Data Video Introduction (3 minutes): Big Bang Data: Dear Data
