
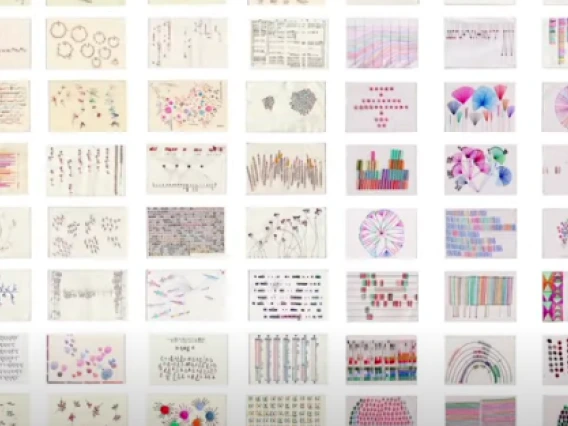
In this year-long data-focused project, students practice data inquiry and visualization methods presented in Dear Data: A Friendship in 52 Weeks of Postcards to visualize a year's worth of data in a variety of ways. This activity allows students to practice skills including data analysis, group collaboration, and reflective learning. It can be modified or adapted to remove, change, or add data sets. The activities can be used as bell work, warmups, or a full class period lesson.
Each quarter has weekly data lessons. The slide deck for each quarter includes teacher notes.
- Objective
- To provide students an opportunity to engage with data, explore creative visualization of data, develop data literacy skills, practice collaboration, and reflection/feedback skills.
- Grades: 6 to 8, adaptable to upper elementary and high school
- Time: 4 sessions per data set, bell work, lesson or or stand alone daily activity
- Author: A Buckley
Arizona Standards Engaged
Science and Engineering Practices:
-Apply concepts of statistics and probability (including mean, median, mode, and variability) to analyze and characterize data, using digital tools when feasible.
-Analyze and interpret data in order to determine similarities and differences in findings.
-Construct, analyze, and interpret graphical displays of data to identify linear and nonlinear relationships.
Lesson Plan and Rubric
Quarter 1
Quarter 2
Quarter 3
Quarter 4
Dear Data Resources
Dear Data Website: https://www.dear-data.com/theproject
Dear Data Video Introduction (3 minutes): Big Bang Data: Dear Data
