
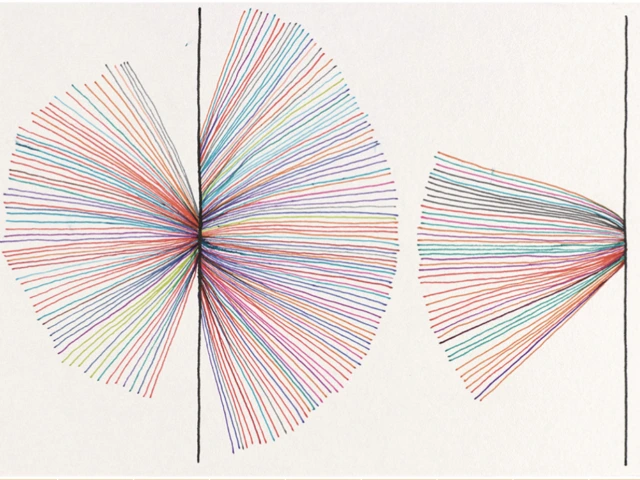
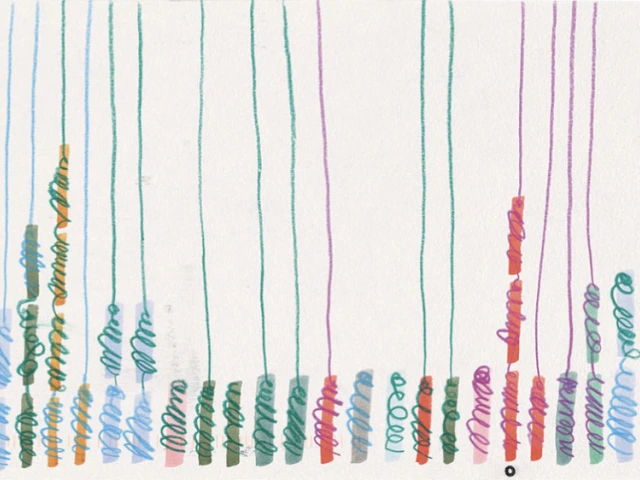
In this lesson, students will explore how data can be represented artistically, inspired by the Dear Data project. They will brainstorm ideas for data collection and learn basic techniques for designing data visualizations. This activity will include a homework assignment to collect data over the course of a week.
- Objectives
- To introduce students to the concept of visualizing personal data through artistic expression inspired by the Dear Data project.
- Grades: 6 to 8
- Time: 15 minutes
- Author: C Shepard
Arizona Standards Engaged
Science and Engineering Practices:
-Apply concepts of statistics and probability (including mean, median, mode, and variability) to analyze and characterize data, using digital tools when feasible.
-Analyze and interpret data in order to determine similarities and differences in findings.
-Construct, analyze, and interpret graphical displays of data to identify linear and nonlinear relationships.
Lesson Plan
Teaching Slides
