These lessons foster a deep connection between observation, data collection, and creative visual representation, anchored in authentic inquiry and reflective practice. The integration of math and science supports cross-disciplinary literacy and critical thinking, while differentiation ensures accessibility for diverse learners.
Each lesson has an objective, step by step instructions, and a rubric.
- Objective
- Students define data and practice detailed observation using See–Think–Wonder
- Students collect quantitative data and represent it visually using tally charts and simple graphs
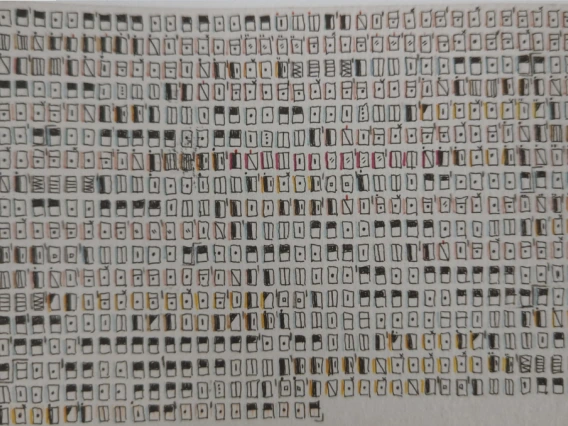
- Students create a personalized system of symbols using color, shape, and size to represent data
Students organize visual data using grids, timelines, or other layout tools to improve clarity
Students develop a personal inquiry question, collect and visualize data, and present findings with reflection
- Grades: 6 to 8, adaptable to upper elementary and high school
- Time: 5 days (One day per lesson)
- Author: A Shirley
Arizona Standards Engaged
Lesson 1: Introduction to see-think-wonder
Detailed step by step instructions in lesson plan.
Document
Lesson 2: Quantitative Data Collection and Visualization

Lesson #3
Lesson #4